Housing Program & Goals
OCII became the Successor Agency to the SFRA after SFRA was dissolved in 2012 pursuant to state law. As Successor Agency, OCII’s work activities are focused on enforceable obligations that have been approved by the State Department of Finance (“DOF”). OCII’s “Retained Housing Obligations” include ensuring the development of affordable housing in OCII’s approved Project Areas, and as part of the new Replacement Housing Obligation.
OCII directly carries out affordable housing development design review, entitlement,underwriting and funding. In addition, OCII procures services from the Mayor’s Office of Housing and Community Development ("MOHCD") through a Memorandum of Understanding for outreach and marketing for both inclusionary and OCII-funded projects, implementing the Certificate of Preference program, assisting with the fiscal management and disbursement of OCII’s funds, some construction monitoring, and other ancillary tasks as needed. Upon completion of the projects, OCII transfers the affordable housing assets such as land, funding agreements, ground leases, and affordability restrictions for each completed project to MOHCD, which is then responsible for all asset management responsibilities.
Tables 4A-H reflect all OCII housing obligations and production goals as of June 30, 2025.
Of OCII’s 27,760 planned total housing units, 13,023 (47% of the total) will be affordable. As of the end of FY 24-25, a total of 9,649 housing units (35% of the total goal) have been completed. Of these completed units, 3,091 or 33% are affordable units and 6,558 are market rate units.
The total affordable units comprise both 100% OCII-funded affordable projects and inclusionary units in market rate projects.
More information on OCII’s Project Areas can be found on OCII’s website: OCII Projects Overview
FY 2024-2025 Annual Housing Report
Tables 4A-H (see pages 13-21) reflect all OCII housing obligations and production goals as of June 30, 2025.
Of OCII’s 27,760 planned total housing units, 13,023 (47% of the total) will be affordable. As of the end of FY 24-25, a total of 9,649 housing units (35% of the total goal) have been completed. Of these completed units, 3,091 or 33% are affordable units and 6,558 are market rate units.
The total affordable units comprise both 100% OCII-funded affordable projects and inclusionary units in market rate projects.
More information on OCII’s Project Areas can be found on OCII’s website: https://sfocii.org/projects
Housing Types
Rental housing in OCII’s projects include Family Rental (generally a mix of bedroom sizes, with no other population restrictions), Senior Rental (for those 62 years or older), and Supportive. Rental (for formerly homeless households or other special needs). Rental units in 100% affordable developments typically offer services programming along with affordable rents. Homeownership units are typically condos in multi-family buildings or towers. Affordable homeownership units are offered to first time homebuyers through a limited equity program.
Table 3 reflects that 58% of completed units are for family rental, 1% are for senior rental, and 37% of completed units are for homeownership.
Table 3: Total Units by Housing Type
| TYPE | Completed | % Completed Units by Housing Type | Affordable Units Completed | In Construction | Predevelopment | Preliminary Planning | Future Development | Grand Total |
|---|---|---|---|---|---|---|---|---|
| TABLE 3. STATUS OF TOTAL UNITS BY HOUSING TYPE AS OF JUNE 30, 2025 | ||||||||
| Family Rental | 5,561 | 58% | 2,059 | 184 | 910 | 872 | 0 | 7,527 |
| Senior Rental | 140 | 1% | 140 | 151 | 361 | 80 | 732 | |
| Supportive Rental | 380 | 4% | 378 | 380 | ||||
| Homeownership | 3,568 | 37% | 514 | 1,381 | 21 | 4,970 | ||
| TBD | 0% | 579 | 13,572 | 14,151 | ||||
| TOTAL | 9,649 | 100% | 3,091 | 335 | 2,291 | 1,833 | 13,652 | 27,760 |
Hunters Point Shipyard Phase I
For Hunters Point Shipyard Phase I ("HPSY Phase I"), the total housing production goal at full build-out is 1,428 units, of which 29% (or 407 units) will be affordable, not including any units that may be approved in the future fulfilling the Replacement Housing Obligation. HPSY Phase I is divided into two areas, the “Hilltop”, where all the housing development to date has occurred, and the “Hillside”, which underwent infrastructure construction but has not yet started vertical development. Table 4C (see page 15) shows that in HPSY Phase I, housing production at the end of FY 24-25 was 54% complete with 767 units completed. Of those completed units, 293 are affordable housing units including 52homeownership units within market rate buildings on multiple blocks within the Hilltop, and another 59 inclusionary rental units in a 100% affordable project.
HPSY Phase I is not a part of the Navy’s retesting efforts described below and has been confirmed by the U.S. Environmental Protection Agency and the California Department of Public Health ("CDPH") to be safe for people to live and work there.
Out of an abundance of caution, OCII worked with the developers to establish a scope of additional soil testing at OCII’s stand-alone affordable sites at Blocks 52 & 54, and Block 56 to be conducted along with the standard Phase II environmental testing.
In 2021, OCII and the developers’ environmental consultant, Langan Engineering and Environmental Services, collected soil borings from Blocks 52, 54 and 56 for that testing. These testing results indicate Blocks 52, 54, and 56 to be safe for people to live and work there.
Construction began on Blocks 52 and 54 and Block 56 in FY 22-23 and completed in FY 24-25 adding a total of 185 units (including 3 managers’ units)
ranging in affordability from 30% to 50% AMI to the Hilltop.
Hunters Point Shipyard Phase II/Candlestick Point
For Hunters Point Shipyard Phase II/Candlestick Point ("HPSY Phase II/CP"), the total housing production goal at full build-out is 10,672 units, of which approximately 32% or 3,363 units will be affordable (not including any units that may be approved in the future, fulfilling the Replacement Housing Obligation). The affordable housing program in HPSY Phase II/CP is unique in that it includes the broadest range of affordability, providing typical affordable units serving households ranging from very low-income households up to those at 0% up to 120% of AMI, as well as “workforce” housing that will serve slightly higher incomes of 140% to 160% of AMI.
Table 4D (see page 16) shows that in HPSY Phase II/ CP housing production at the end of FY 24-25 was 3% complete. Those completed units are all part of the new housing in Candlestick Point for the HOPE SF revitalization of the Alice Griffith public housing development. The three market rate units represent the onsite property managers’ units, which are not income restricted.
The land in HPSY Phase II is in a Federal “Superfund” site still owned by the Navy and requires clean-up by the Navy. Portions of HPSY Phase II are the subject of a re-testing program of the work performed by Navy contractors. No construction is currently occurring on any of the HPSY Phase II parcels, and OCII will not accept any land or begin any development on HPSY Phase II until each parcel is tested and determined by regulatory agencies to be safe.
FY 23-24, OCII and the master developer for the project area undertook a re-entitlement process, which was approved early in FY 24-25 that will allow one affordable development to restart predevelopment work and another to begin predevelopment work in FY 25-26.
Mission Bay North and South
Together, the Mission Bay North ("MBN") and South ("MBS") total housing production goal at full build- out is 6,535 units, of which 29% (or 1,907 units) will be affordable. Planned housing construction in the two Project Areas combined was 97% complete at the end of FY 24-25 for a total of 6,349 units. Table 4E (see page 17) reflects housing completions in MBN, which was fully completed in FY 16-17, providing 2,266 market rate units and 698 affordable units (24% of the total units). Table 4F (see page 18) shows that in MBS, the Project Area was 95% complete at the end of FY 24-25, with 3,385 units completed out of 3,571. As of FY 24-25, market rate units were 99% complete, and 86% of the OCII affordable units were completed. At full build-out, not including any units that may be approved in the future fulfilling the Replacement Housing Obligations, housing in MBS will be 34% affordable.
OCII is exploring approaches that will increase the density of the remaining 2 affordable housing parcels in MBS. In FY 23-24 OCII issued a Request for Qualifications for one of those parcels, MBS Block 4E which will contain 2 100% affordable developments and up to 400 units. In FY 24-25 predevelopment began on MBS Block 4E with the first phase of development scheduled to start construction in FY 26/27.
Increasing density will require local approvals, including an amendment of the redevelopment plan and associated governing documents.
Transbay
Overall, 35% of all new housing in Zones 1 and 2 of the Project Area combined must be affordable. OCII must achieve this requirement by the expiration of the Transbay Redevelopment Plan in 2035.
In Transbay Zone 1 for which OCII has land use and zoning jurisdiction, the total housing production goal at full build-out is 3,276 units, of which 46% (or 1,508 units) will be affordable, not including any units that may be approved in the future fulfilling the Replacement Housing Obligation.
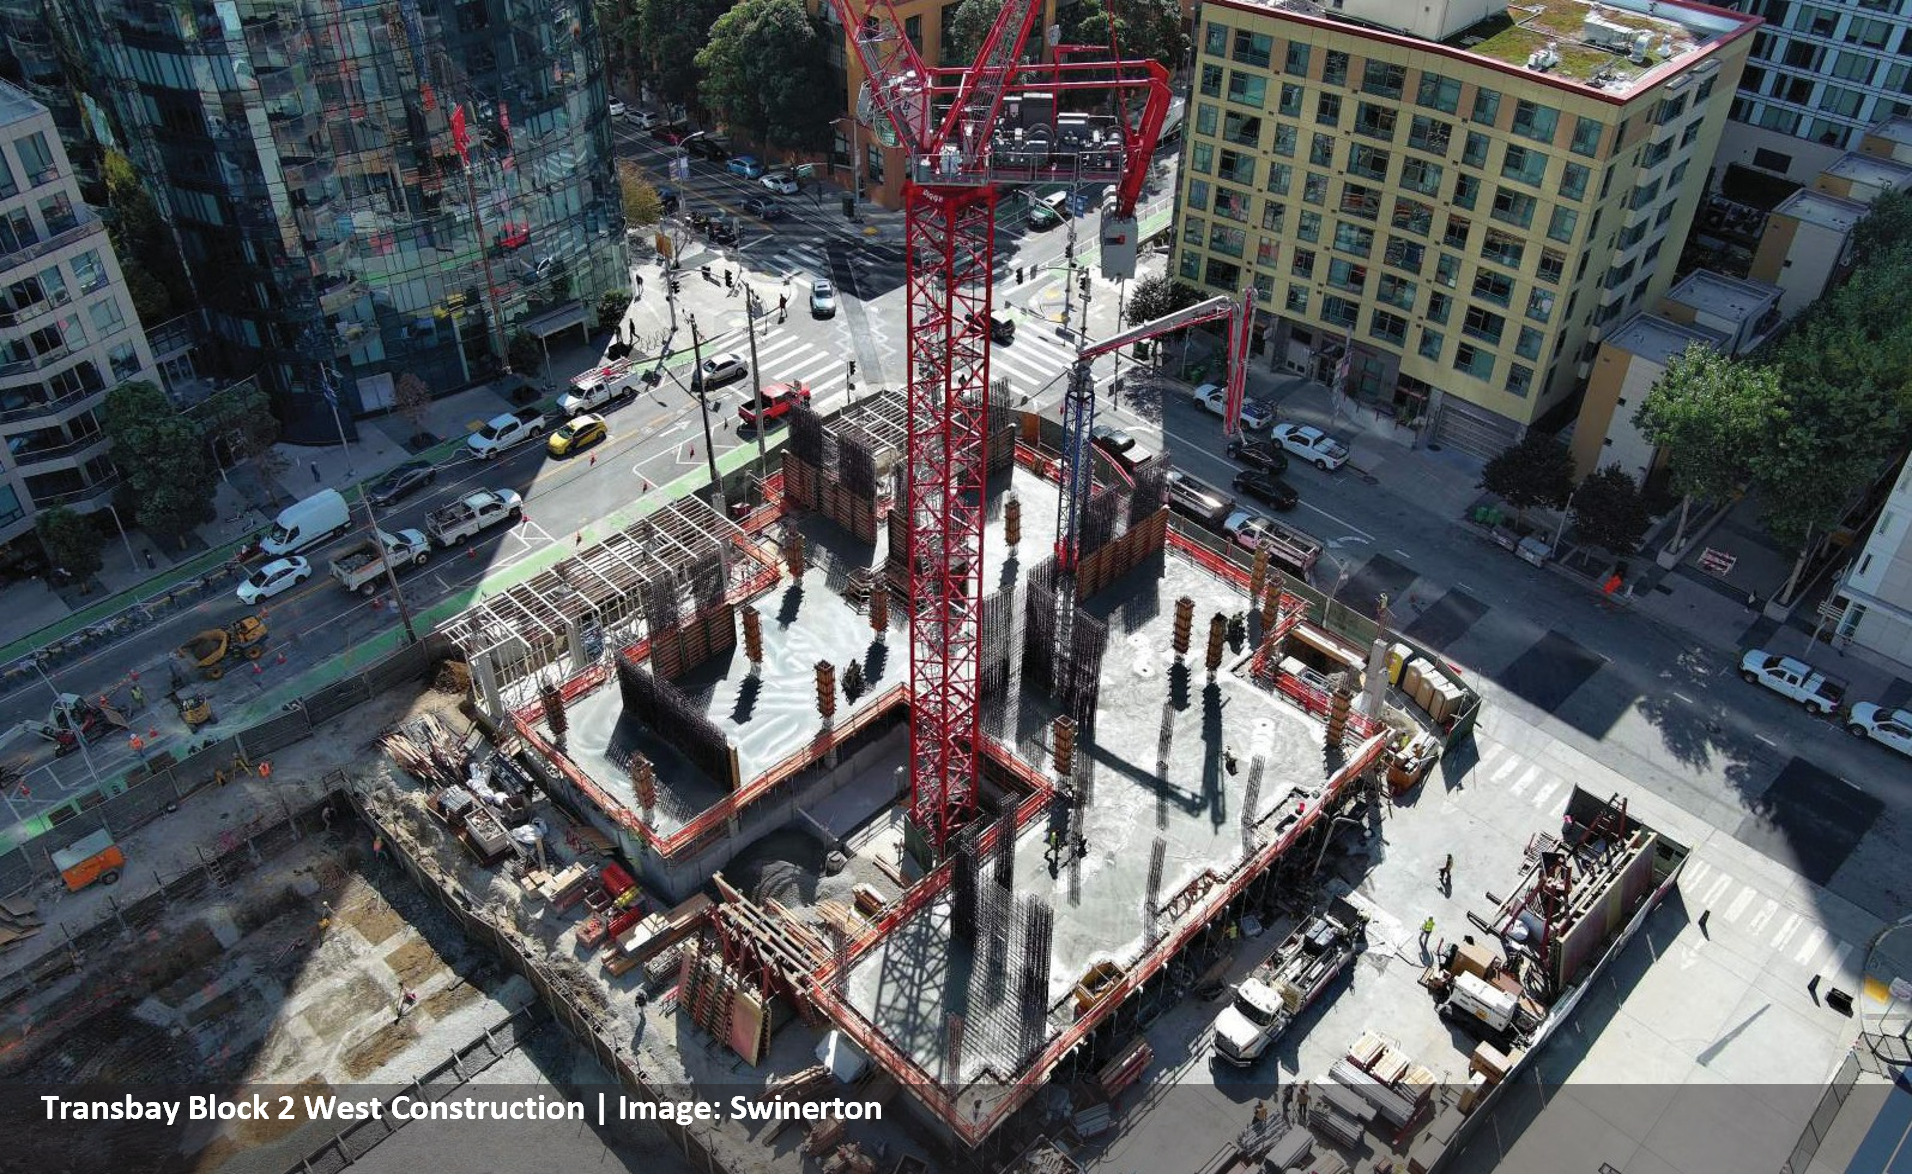
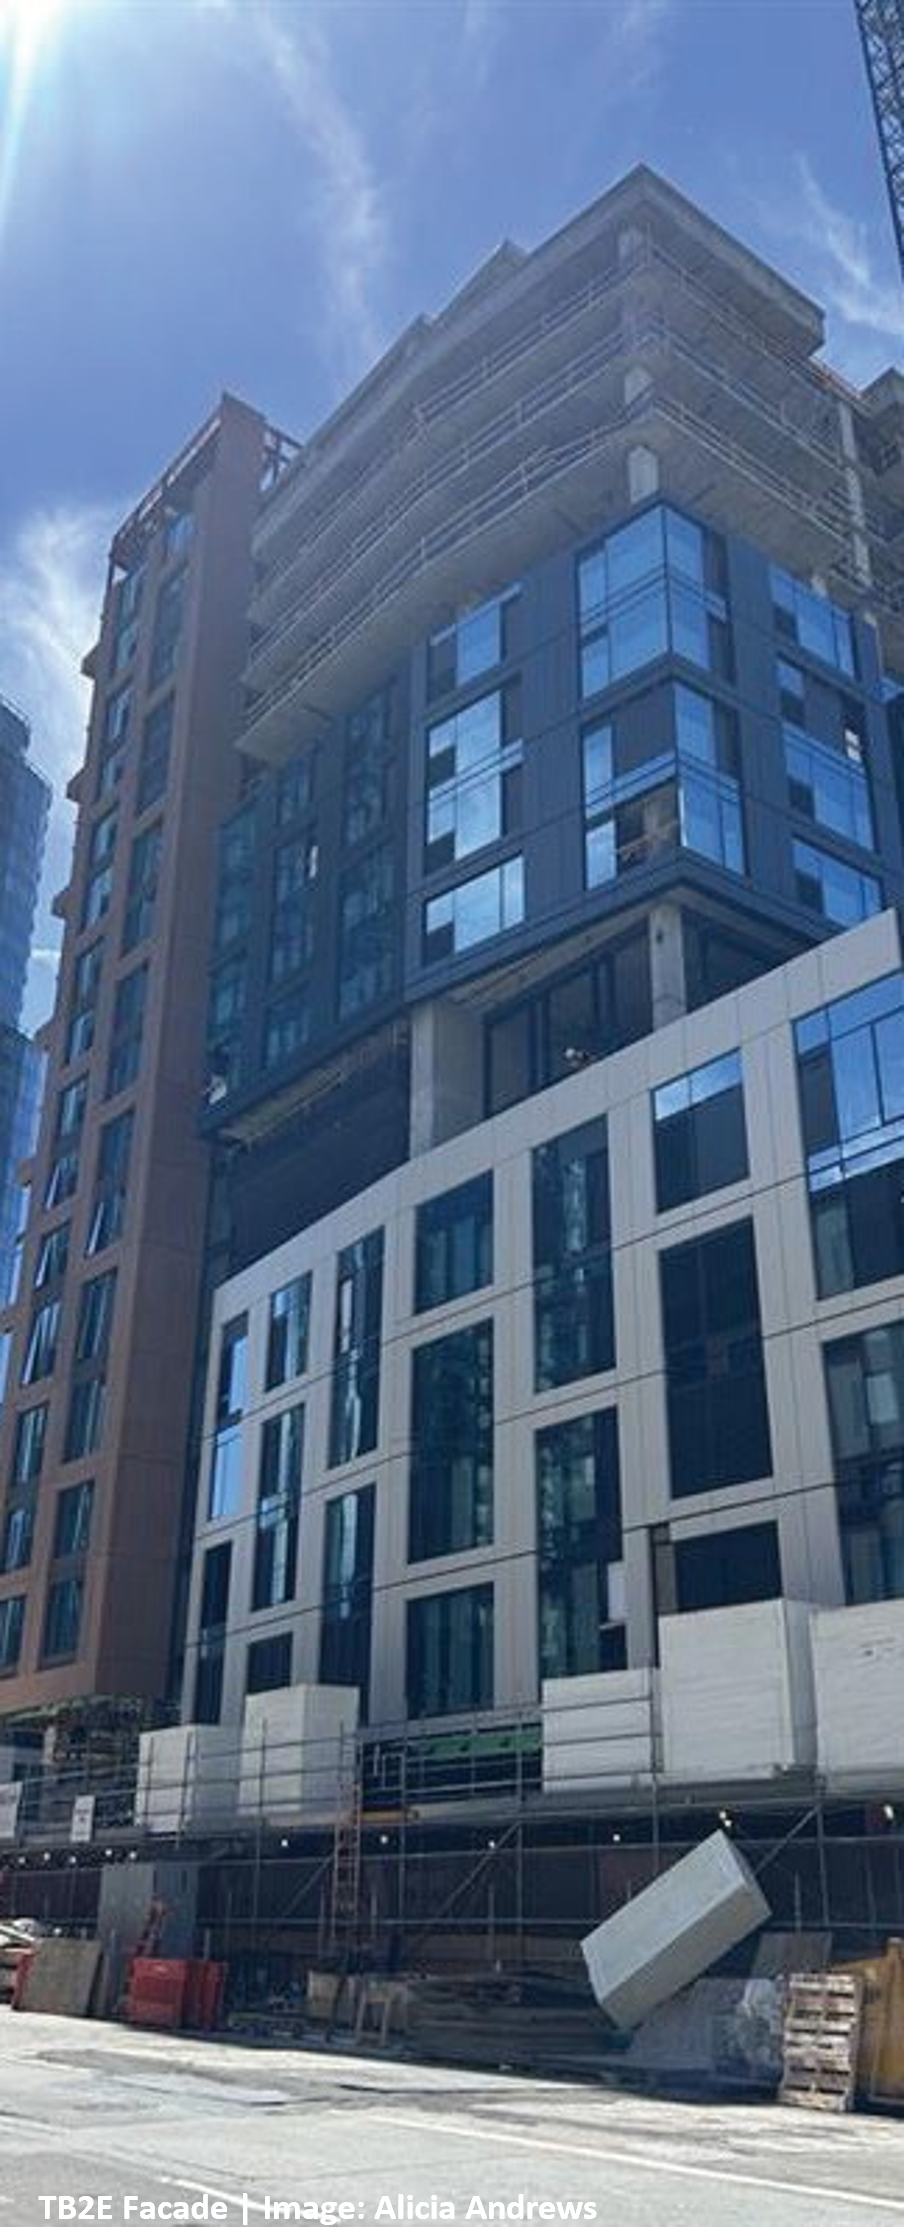
In FY 23-24 construction began on 2 100% affordable developments in Transbay Zone 1 totaling 335 units including managers’ units. These units were under construction throughout FY 24-25 with both on track for a FY 25-26 completion.
In FY-23-24 the mixed-income Block 4 option expired and staff began analysis of proceeding with 2 affordable projects on a portion of the site in order to expedite affordable housing delivery while creating a more financially feasible market rate site on the block. In FY 24-25 OCII issued an RFP seeking a development team to build approximately 325 affordable units on Transbay Block 4W, leaving a portion of the site on Transbay Block 4E for a future development that will likely include market rate and inclusionary affordable units.
Table 4G.1 (see page 19) shows that in Transbay Zone 1, housing production at the end of FY 24-25 was 67% complete with 2,196 units. Of these completed units in Zone 1,463 were affordable units in OCII-funded, 100% affordable housing developments.
Transbay Zone 2 is under the jurisdiction of the City’s Planning Department, and not a subject of this report. However, Table 4G.2 (see page 20) is presented to show Transbay Zones 1 and 2 combined. In FY 23-24 530 Howard in Zone 2 was approved by the City’s Planning Department. This results in a projected 35% affordability across Zone 1 and Zone 2.
Replacement Housing
The Community Redevelopment Law (“CRL”) required redevelopment agencies to construct affordable units whenever it destroyed or removed units that had been occupied by low- or moderate-income households. This requirement became effective January 1, 1976, and applied only to future actions of a redevelopment agency and established several standards for the type of housing developed as replacement housing.
Prior to 1976, SFRA had destroyed, as part of the federally-funded 1954 Housing Act urban renewal program, 14,207 affordable units. Although the CRL authorized redevelopment agencies to replace the affordable units destroyed before 1976, San Francisco sought and obtained special legislation in 2000 that provided additional tax increment financing to complete those units. Prior to its dissolution, SFRA was only able to approve and develop 867 replacement units out of the total 6,709 units destroyed but never replaced by SFRA, leaving an outstanding balance of 5,842 affordable units that needed to be replaced. Since the 2012 dissolution of the Former Agency, the City and OCII unsuccessfully sought on several occasions to re-establish the Replacement Housing Obligation.
SB 593, which was signed by Governor Newsom in October 2023, authorizes OCII to create enforceable obligations to cause the construction of and to issue bonds or incur other indebtedness for the purpose of financing the construction of replacement affordable housing units demolished and not replaced by SFRA and the replacement of the obsolete affordable units that were constructed previously. SB 593 relies on the standards in the CRL for developing replacement housing provided that the funding is limited to the property tax revenues available in the Redevelopment Property Tax Trust Fund in the amounts on deposit that otherwise would be distributed to the City and County of San Francisco ("Residual Tax Increment") The CRL requirements are as follows:
• may be built anywhere within the territorial jurisdiction of the city or county in which the redevelopment agency was located;
• must be available at “affordable housing cost to persons in the same or a lower income category (low, very low, or moderate), as the persons displaced from those destroyed or removed units;
• must remain affordable “for the longest feasible time, [which] includes, but is not limited to, unlimited duration;
• must be subject to affordability restrictions enforceable through recorded covenants; and are independent of a redevelopment agency’s other obligations to produce housing
• SB 593 adds to existing OCII authority under Redevelopment Dissolution Law to finance and develop affordable housing required under enforceable obligations previously approved by the DOF, for MBN, MBS, Transbay, HPSY Phase 1, and HPSY Phase 2/CP, but limits the source of funding for replacement housing to City Residual Funds.
SB 593 authorizes certain funding for the development, construction, repair, renovation, or reconstruction of up to 5,842 units of affordable housing that shall be and remain affordable to, and occupied by, persons and families of extremely low, very low and moderate income households for the longest feasible time, but not less than 55 years for rental units and 45 years for owner-occupied units.
The funding for the Replacement Housing Obligation will depend on future property tax revenues generated in former and current redevelopment project areas and on the funding needs of existing OCII enforceable obligations, which will have a higher priority under law for the use of the property tax revenues. In addition, available funds will depend on the budget needs of the City which would otherwise deposit the funds in its general fund. OCII is working with the City on estimates of the amount of revenue that will be available in light of the state of the overall city budget. The current City budget constraints could affect the timing and the amount of the initial bond issuance.
In FY 23-24 OCII issued an RFQ for MBS Block 4E, a parcel that will contain two 100% affordable developments, and up to 400 units. In FY 24-25 Commission approved a predevelopment loan of $5.1M allowing predevelopment to begin on these projects. Over 233 of those units would be in excess of the remaining Mission Bay South enforceable obligation. Subject to Commission approval and City budget constraints, the additional 233 units in MBS Block 4E will be some of the first Replacement Housing units approved under SB 593.
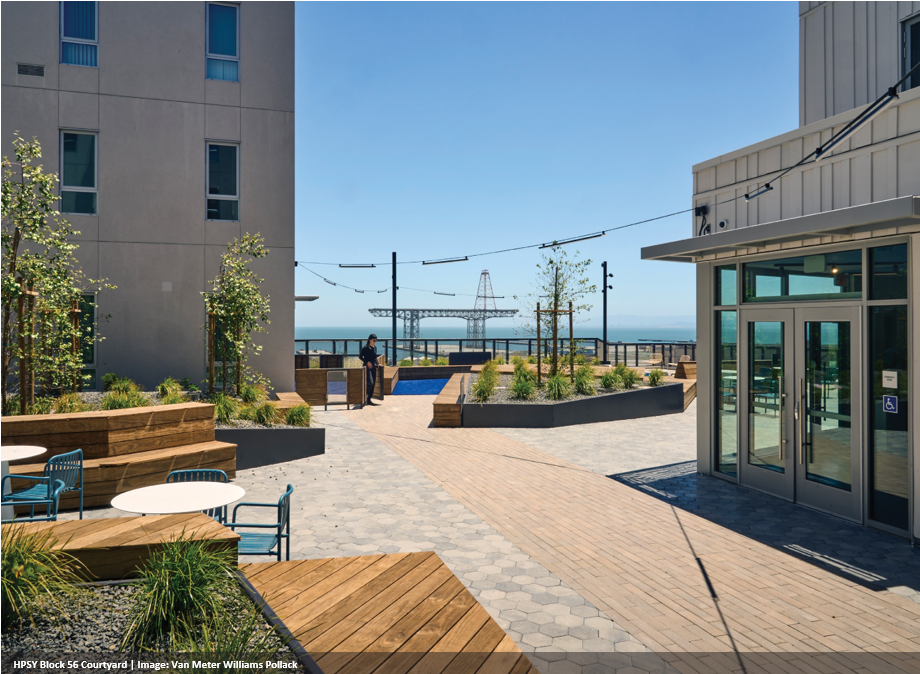
Table 4: Housing Production Goals and Status by Project Area
| . | Total Units | Market Rate | Inclusionary Affordable | OCII Affordable | Total Affordable |
|---|---|---|---|---|---|
| TABLE 4. HOUSING PRODUCTION GOALS AND STATUS BY PROJECT AREA | |||||
| TABLE 4A. HOUSING STATUS FOR ALL AREAS, AS OF JUNE 30, 2023 | |||||
| Completed as of 6/30/25 | 9,649 | 6,558 | 660 | 2,431 | 3,091 |
| In Construction | 335 | 3 | - | 332 | 332 |
| Predevelopment | 2,291 | 1,418 | 147 | 726 | 873 |
| Preliminary Planning | 1,833 | 866 | 162 | 805 | 967 |
| Future Development | 13,652 | 5,891 | 1,557 | 6,203 | 7,760 |
| TOTAL | 27,760 | 14,736 | 6,203 | 10,497 | 13,023 |
| % AFFORDABLE AT TOTAL BUILD OUT | 47% | ||||
| AFFORDABLE UNITS AS % OF TOTAL COMPLETED | 32% | ||||
| % COMPLETE, ALL UNITS | 35% | ||||
*OCII affordable does not include manager’s units
Table 4. Housing Production Goals and Status by Enforceable Obligation
| . | Hunters Point Shipyard Phase I | Hunters Point Shipyard Phase II & Candlestick Point | Mission Bay North & South | Transbay | Total |
|---|---|---|---|---|---|
| TABLE 4. HOUSING PRODUCTION GOALS AND STATUS BY PROJECT AREA | |||||
| TABLE 4B. AFFORDABLE AND MARKET RATE HOUSING STATUS BY ENFORCEABLE OBLIGATION, AS OF JUNE 30, 2025 | |||||
| Completed | 767 | 337 | 6,349 | - | 9,649 |
| In Construction | - | - | - | - | 335 |
| Predevelopment | 628 | 1,263 | 165 | 235 | 2,291 |
| Preliminary Planning | - | 1,225 | 21 | 262 | 1,833 |
| Future Development | 33 | 7,847 | - | 5,352 | 13,652 |
| TOTAL | 1,428 | 10,672 | 6,535 | 5,849 | 27,760 |
| % COMPLETE | 54% | 3% | 97% | 0% | 35% |
| . | Total Units | Market Rate | Inclusionary Affordable | OCII Affordable | Total Affordable |
|---|---|---|---|---|---|
| TABLE 4. HOUSING PRODUCTION GOALS AND STATUS BY PROJECT AREA | |||||
| TABLE 4C. HUNTERS POINT SHIPYARD PHASE I STATUS, AS OF JUNE 30, 2025 | |||||
| Completed | 767 | 474 | 111 | 182 | 293 |
| In Construction | - | - | - | - | - |
| Predevelopment | 628 | 548 | 80 | - | 80 |
| Preliminary Planning | - | - | - | - | - |
| Future Development | 33 | - | - | 33 | 33 |
| TOTAL | 1,428 | 1,022 | 191 | 215 | 406 |
| % COMPLETE AS OF JUNE 20, 2024 | 54% | 46% | 58% | 84% | 73% |
| AT FINAL BUILD OUT, % AFFORDABLE OF TOTAL UNITS: 29% | |||||
*OCII affordable does not include manager’s units
| . | Total Units | Market Rate | Inclusionary Affordable | OCII Affordable | Total Affordable |
|---|---|---|---|---|---|
| TABLE 4. HOUSING PRODUCTION GOALS AND STATUS BY PROJECT AREA | |||||
| TABLE 4D. HUNTERS POINT SHIPYARD PHASE II / CANDLESTICK POINT STATUS, AS OF JUNE 30, 2025 | |||||
| Completed | 337 | 4 | 333 | 333 | |
| In Construction | |||||
| Predevelopment | 1,263 | 866 | 67 | 330 | 397 |
| Preliminary Planning | 1,225 | 839 | 162 | 224 | 386 |
| Future Development | 7,847 | 5,600 | 1,506 | 741 | 2,247 |
| TOTAL | 10,672 | 7,309 | 1,735 | 1,628 | 3,363 |
| % COMPLETE AS OF JUNE 30, 2024 | 3% | 0% | 0% | 21% | 10% |
| AT FINAL BUILD OUT, % AFFORDABLE OF TOTAL UNITS: 32% | |||||
*OCII affordable does not include manager’s units
| . | Total Units | Market Rate | Inclusionary Affordable | OCII Affordable | Total Affordable |
|---|---|---|---|---|---|
| TABLE 4. HOUSING PRODUCTION GOALS AND STATUS BY PROJECT AREA | |||||
| TABLE 4E. MISSION BAY NORTH STATUS, AS OF JUNE 30, 2025 | |||||
| Completed | 2,964 | 2,266 | 291 | 407 | 698 |
| In Construction | - | - | - | - | - |
| Predevelopment | - | - | - | - | - |
| Preliminary Planning | - | - | - | - | - |
| Future Development | - | - | - | - | - |
| TOTAL | 2,964 | 2,266 | 291 | 407 | 698 |
| % COMPLETE AS OF JUNE 30, 2024 | 100% | 100% | 100% | 100% | 100% |
| AT FINAL BUILD OUT, % AFFORDABLE OF TOTAL UNITS: 24% | |||||
*OCII affordable does not include manager’s units
| . | Total Units | Market Rate | Inclusionary Affordable | OCII Affordable* | Total Affordable |
|---|---|---|---|---|---|
| TABLE 4. HOUSING PRODUCTION GOALS AND STATUS BY PROJECT AREA | |||||
| TABLE 4F. MISSION BAY SOUTH STATUS, AS OF JUNE 30, 2025 | |||||
| Completed | 3,385 | 2,339 | - | 1,046 | 1,046 |
| In Construction | - | - | - | - | - |
| Predevelopment | - | - | - | - | - |
| Preliminary Planning | 186 | 23 | - | 163 | 163 |
| Future Development | - | - | - | - | - |
| TOTAL | 3,571 | 2,362 | - | 1,209 | 1,209 |
| % COMPLETE as of june 30, 2024 | 95% | 99% | - | 87% | 87% |
| AT FINAL BUILD OUT, % AFFORDABLE OF TOTAL UNITS: 24% | |||||
*OCII affordable does not include manager’s units
| . | Total Units | Market Rate | Inclusionary Affordable | OCII Affordable | Total Affordable |
|---|---|---|---|---|---|
| TABLE 4. HOUSING PRODUCTION GOALS AND STATUS BY PROJECT AREA | |||||
| TABLE 4G.1 TRANSBAY STATUS, ZONE 1 ONLY, AS OF JUNE 30, 2025 | |||||
| Completed | 2,196 | 1,475 | 258 | 463 | 721 |
| In Construction | 335 | 3 | - | 332 | 332 |
| Predevelopment | - | - | - | - | - |
| Preliminary Planning | 325 | 3 | - | 322 | 322 |
| Future Development | 420 | 290 | 51 | 79 | 130 |
| TOTAL | 3,276 | 1,771 | 309 | 1,196 | 1,505 |
| % COMPLETE AS OF JUNE 30, 2024 | 67% | 83% | 83% | 39% | 48% |
AT FINAL BUILD OUT OF ZONE 1, % AFFORDABLE OF TOTAL UNITS: 46% AT FINAL BUILD OUT OF ZONE 1, INCLUDING ESTIMATED ZONE 2 UNITS (STATE LAW REQUIREMENT) % AFFORDABLE: 36% | |||||
*OCII affordable does not include manager’s units
| . | Total Units | Market Rate | Inclusionary Affordable | OCII Affordable | Total Affordable |
|---|---|---|---|---|---|
| TABLE 4. HOUSING PRODUCTION GOALS AND STATUS BY PROJECT AREA | |||||
| TABLE 4G.2 TRANSBAY STATUS, ZONES 1 AND 2 COMBINED, AS OF JUNE 30, 2025 | |||||
| Completed | 2,666 | 1,885 | 318 | 463 | 781 |
| In Construction | 335 | 3 | - | 332 | 332 |
| Predevelopment | - | - | - | - | - |
| Preliminary Planning | 325 | 3 | - | 322 | 322 |
| Future Development | 1,257 | 1,059 | 119 | 79 | 198 |
| TOTAL | 4,583 | 2,950 | 437 | 1,196 | 1,633 |
| % COMPLETE | 58% | 64% | 73% | 39% | 48% |
| AT FINAL BUILD OUT, % AFFORDABLE OF TOTAL UNITS: 33% | |||||
*OCII affordable does not include manager’s units
**Zone 2, although not in OCII’S jurisdiction, is included above to reflect the 35% affordable requirement in Zones 1 and 2 combined
| . | SFHA Pre-Dissolution | Mission Bay South* | Transbay | Hunters Point Shipyard Phase 1* | Hunters Point Shipyard Phase 2/CP | TBD/OUtside of Current Project Areas | TOTAL |
|---|---|---|---|---|---|---|---|
| TABLE 4. HOUSING PRODUCTION GOALS AND STATUS BY PROJECT AREA |
| ||||||
| TABLE 4H. REPLACEMENT HOUSING STATUS, AS OF JUNE 30, 2025 |
|
| |||||
| Completed as of 6/30/25 | 867 | - | - | - | - | - | 867 |
| In Construction | - | * | - | - | - | - | 0 |
| Predevelopment | - | 233 | - | - | - | - | 233 |
| Preliminary Planning | - | 259 | - | - | - | - | 259 |
| Future Development | - | - | - | 111 | - | 5,241 | 5,352 |
| TOTAL | 867 | 492 | 0 | 111 | 0 | 5,241 | 6,711 |